Estimated Plus-Minus (EPM) and Estimated Skills
Estimated Plus-Minus (EPM) is an all-in-one player metric that predicts a player's contribution to the team in points per 100 possessions. Previously, EPM was retrodictive, estimating past impact using only data in individual seasons. While this version stabilized fairly quickly and had some predictive quality, there was much to be gained by using more data and optimizing it to be forward looking. EPM is now a predictive metric, using all available data, and built on top of an entirely new machine-learned projection system.
This new projection system generates predicted player stats at each point in time that represent the estimated true skill of the player in each statistical category and are called Estimated Skills (or just "skills"). These stats are highly optimized to know the difference between random fluctuations and true ability and serve as a powerful underpinning to EPM. EPM and estimated skills update nightly and are available for every day of basketball since the 2001-02 season. These values represent the predicted impact or predicted statistical value the player will have at that point in time given all data leading up to that point while considering how important factors--such as age, within-season trends, time on current team, opponent strength, etc.--uniquely affect each stat. EPM and skill methodologies are explained below.
The Need for Adjustment to Plus-Minus
The concept of plus-minus to capture player impact is a sensible one. Raw plus-minus, found in NBA boxscores, is the net team points while the player is on the court. If a team tends to score more points than opponents while a player is on the court, then perhaps the player is impacting team success. If you could randomize who players play with and against for a lot of sample for each combination, then raw plus-minus would be a nearly perfect measure of player impact. Unfortunately, coaches don't want to randomize their rotations, general managers don't want to make random trades, and players can only play so many games. In the real world, raw plus-minus is very biased and goes up and down based on many, many factors beyond what the player is actually contributing, and is thus extremely noisy even in seemingly large samples.
As an example, in the 2023-24 NBA regular season among qualifying players, Kentavious Caldwell-Pope, Payton Pritchard, Luke Kornet, Kenrich Williams, Jusuf Nurkic, Nickeil Alexander-Walker, and Lu Dort all had a higher raw on-court plus-minus per 100 possessions than Stephen Curry, Giannis Antetokounmpo, Luka Doncic, and Devin Booker (source: basketball reference play-by-play). While the former are fine players, you would be hard-pressed to find any respectable scout or analyst to conclude they are more impactful than the latter.
You may have noticed a pattern above with the players mentioned that many with high plus-minus happen to play alongside really great players on good teams (Caldwell-Pope next to Nikola Jokic, Payton Pritchard and Luke Kornet on a great Celtics team, etc.). This illustrates that one of the major problems with raw plus-minus is that it is blind to context--it is not aware of bias due to who players are playing with (or against).
In addition to bias due to real-world player rotations, sample size limitations can make it difficult to capture individual player contribution. For example, it is often the case when a player has a suspiciously high or low raw plus-minus that they just happened to be on the court during random slices of opponent 3-point shooting sample that don't represent true ability. There may be a temptation to attribute the difference to the player, but it is almost certainly largely due to the random chance as it has been shown that defenses have little control over opponent 3-point shooting percentage.
Enter the longstanding and proven techniques of regularized adjusted plus-minus (RAPM) and statistical plus-minus (SPM) to help mitigate these issues.
Estimated Plus-Minus (EPM) Methodology
EPM has two main components: 1) a statistical plus-minus (SPM) model that uses highly optimized stats (estimated skills) to estimate a player's contribution per 100 possessions, and 2) a regularized adjusted plus-minus (RAPM) calculation which captures impact beyond the stats. Step 1 serves as a jumping off point for the final calculation in step 2, making EPM a Regularized Adjusted Plus-Minus (RAPM) calculation with a Statistical Plus-Minus (SPM) Bayesian prior. More information on each of these methods is below.
Regularized Adjusted Plus-Minus (RAPM)
RAPM is used in the final step to calculate EPM values, but it is also used to create the SPM model in the first step. Adjusted plus-minus (APM) came before RAPM and is a technique to help with the contextual blindness of raw plus-minus. It was initially brought to basketball by Dan Rosenbaum to adjust a player's plus-minus by controlling for who they play with and against, as well as other factors such as home court advantage and the rubber band effect.
Regularized adjusted-plus minus (RAPM) was a very important improvement upon APM and was first introduced by Joe Sill in 2010 at the Sloan Sports Analytics Conference (you can read the abstract here) at which he reported nearly doubling the accuracy of traditional APM. RAPM uses a statistical technique called ridge regression that helps mitigate issues in coefficient estimation due to multicollinearity (players frequently playing together).
RAPM is calculated with a huge ridge regression model but can perhaps be more easily understood as the algebraic approach of solving system of equations in which the unknowns are player values and the equations are team possessions and their outcomes. There are two variables per player (offense and defense) and around 5 million possessions for a 20-year RAPM calculation.
Statistical Plus-Minus (SPM)
The idea of SPM has been around since APM and was also initially used by Dan Rosenbaum in his article referenced in the previous section. RAPM was a massive upgrade to raw plus-minus but is still noisy. SPM uses player-level stats to help stabilize an estimate of their impact per/100 possessions.
To create an SPM model, modern metrics use large multi-season samples of RAPM (to minimize the noise) along with player stats corresponding to the same time frame to empirically estimate how each stat relates to player impact. These weights can then be applied to player stats to get a feel for what their RAPM could be without even calculating it. Output from SPM stabilization is interesting on its own if modeled well, but is limited to only what we can measure in the boxscore, play-by-play, etc. Quite a bit of what is important on offense is measured with player stats, but defensive stats are very much lacking. For more information about SPM, Neil Payne wrote a nice summary about it here. Daniel Myers is the creator of Box Plus/Minus (BPM) which is a fantastic SPM metric with a very thorough write-up--it is also very much a part of the inspiration behind EPM.
Combining SPM and RAPM
EPM is also inspired by Jeremias Engelmann and Steve Illardi's Real Plus-Minus (RPM) which combined these two methods to arrive at even more accurate player values. While Engelmann and Illardi have since moved on, and the formula has changed, RPM values can be found here. RPM used a SPM model as a Bayesian prior in a one-season RAPM calculation called xRAPM with great results. EPM uses a similar methodology but with its own SPM model and a more predictive orientation powered by highly optimized stats called skills, player-tracking data, and data from players' entire careers instead of for individual seasons.
Estimated Skills
Much of the predictive power of EPM is gained by using individually optimized stats which represent estimates of true skill. These player stats are predictions of the most likely value at each point in time given how each stat stabilizes over time, player career performance up to that point, and how important predictive factors--such as age, team and opponent strength, seasonality, etc.--uniquely affects each stat. They are called Skills, for example, 3-point % skill (alternatively, stable 3-point %).
You often hear about the importance of sample size when trusting the accuracy of a stat, but how can you know if it's enough? This problem is exacerbated by the fact that each stat stabilizes at a different rate, i.e. some stats require more sample than others to trust them. Estimated skills essentially solve the sample size problem for you by identifying how much importance should be given to all past games for each stat.
For example, if a player shoots 60% on three-point attempts over the span of 10 games and 50 attempts, what can you expect in the next game? Would it be 60%? No, it would not. But certainly that is an impressive performance, so how much of it is "real"? 3PT% skill tells you how much. In general, 3PT% can be more deceiving in the short term than 2PT% (i.e. needs more sample to trust), but again, how much more? And this distinction is important when considering differences in players' attempt profiles.
Not only does each stat stabilize at different rates, but each stat is affected differently by player age, league-wide within-season trends, home-court advantage, back-to-back games, and other factors. For example, age is helpful in predicting 3-point % but less-so for 3-point attempt frequency. As another example, shooting efficiency is typically lower at the beginning of seasons or when the opponent is good defensively. The biggest driver in predicting player stats in the next game is their optimized, decay-weighted career performance up to that point (as described next), but accounting for these factors helps improve prediction.
Estimated Skill Methodology
To calculate skills, unique predictive models are created for each stat, and these models are tested in a machine learning optimization algorithm called Differential Evolution. The goal of this optimizer is to determine the ideal weights to give all past games for each stat that provide the best prediction in each player's next game given their career up to that point. The weights are exponentially decayed, which means the most recent game is given the most weight and past games are given gradually less weight, and it is the goal of the optimizer to determine how gradual the weights should decay.
More specifically, the optimizer determines the ideal decay factor which is simply a number between 0 and 1 that when exponentiated by the number of days ago for past games gives the weight for those games. The decay factor of 1 gives an equal weight to all past games, but most decay factors are just slightly less than 1. This chart shows the difference in decay given varying hypothetical decay weights.
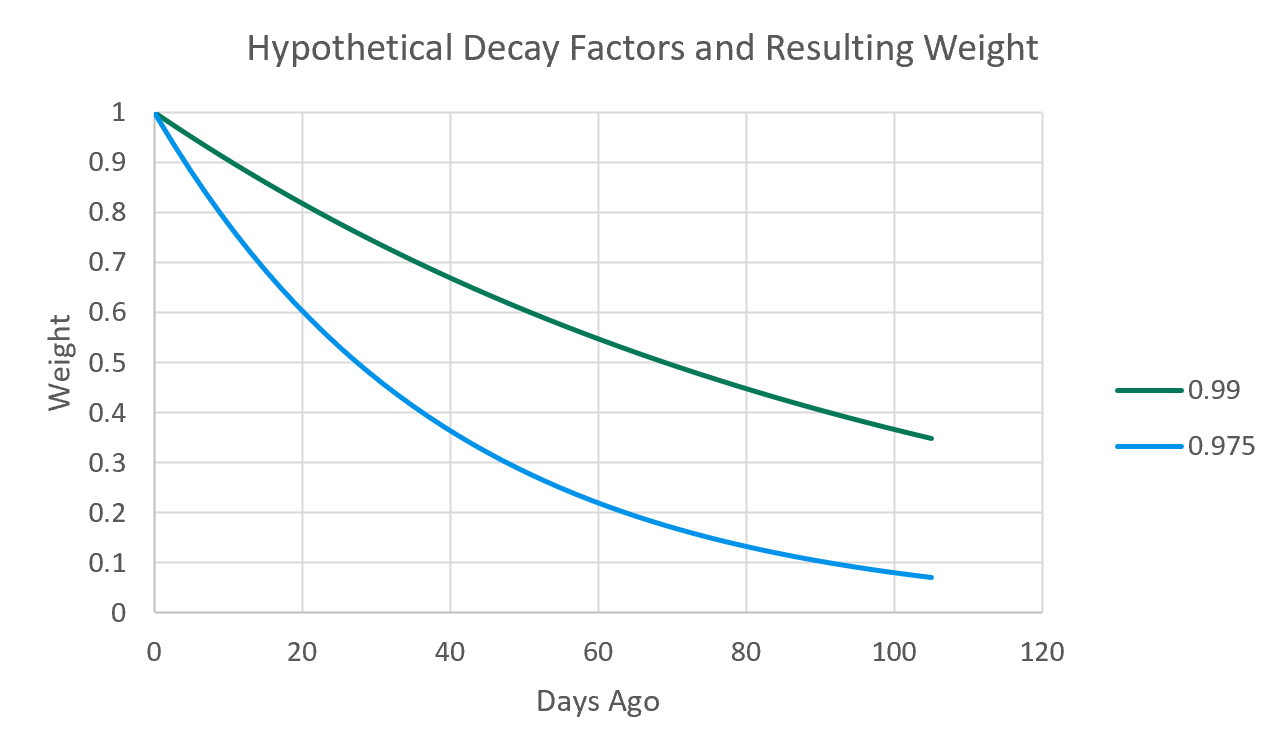
To continue the example of 3PT% versus 2PT%, the former requires more sample to stabilize and therefore will have a higher decay factor than the latter. Days ago and possessions ago are used depending on the stat for determining weights. After the process is complete, estimated skills give you the optimized prediction for each stat and for each player at each point in time. This approach is inspired by Kostya Medvedovsky's DARKO model.
Calculating Estimated Plus-Minus (EPM)
The SPM model for EPM was created using an 18-year RAPM model with regular season and playoff data from the 2001-02 season to the 2018-19 season. A separate SPM model using player tracking data was created with a 6-year RAPM sample from the 2017-18 season to the 2022-23 season. The RAPM calculations used possession-level data allowing to control for home court advantage and the rubber band effect (in which teams/players perform worse when ahead and vise versa). The stats used in training the model include boxscore, play-by-play, and tracking data and were adjusted to be relative to league average at each point in time to account for the ever-evolving NBA game.
The SPM model provides empirical estimates of how important each stat is when taken together in predicting player impact per 100 possessions. These estimates are then applied to the highly optimized skill stats to get predictive SPM values at each point in time.
The predictive SPM values are then used as prior information in exponentially decayed RAPM models for every date of basketball since 2002--over 4,700 cumulative RAPMs in which the most recent RAPM that runs each night uses all possessions since 2002 (over 22 seasons and 5.5 million possessions) weighting more recent possessions more heavily than older ones. These RAPM models also control for home-court and the rubber-band effect. The result is EPM.
Team Ratings using EPM, Game Predictions, and Season Simulations
EPM allows for flexible, more accurate team ratings. Team ratings found throughout the site simply represent the sum of EPM values weighted by predicted minutes at each point in time. Team EPM ratings are used in making game predictions that perform better than using traditional team-level ratings (results below). These game predictions are used in Monte Carlo simulations to generate seeding and playoff probabilities.
Game Prediction Results
The prediction error for margin of victory for games from 2002 to 2023 was compared across different models with random 10-fold cross-validation (using the root-mean-squared-error, or RMSE). Each model controlled for home-court, rest, playoffs, and season. Enhanced traditional team ratings adjusted for schedule (which used an earlier version of EPM combined with before-season Vegas win totals as prior information that blended into traditional SRS ratings as the season progressed), produced an average RMSE of 12.25. Truly traditional adjusted team ratings, such as SRS, likely would have worse prediction error since no before-season information is used. Using the latest EPM values weighted by predicted minutes improved RMSE to 12.14, and using predicted minutes with knowledge of which players were officially designated as inactive before the game improved further to 12.1.